Numbers to KPIs: Aggregated data of treatment adherence programs

Six months of launch data across our treatment adherence programs tells one consistent story: the platform works, and the numbers prove it in ways that go beyond any single metric.
So far, we have looked at individual parts of this story: retention, trust and specialist engagement. Now, by putting the numbers side by side, we can see the bigger picture: how StayOnTreatment is being adopted, how consistently it is being used and what the data tells us about treatment adherence at scale.
From 2.9% to <0.25%: Retention at scale
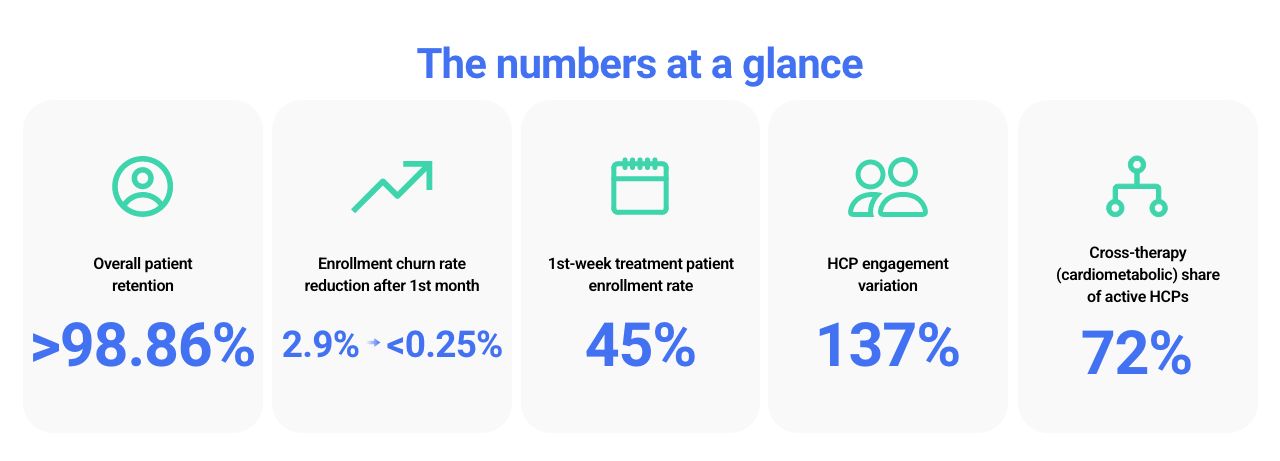
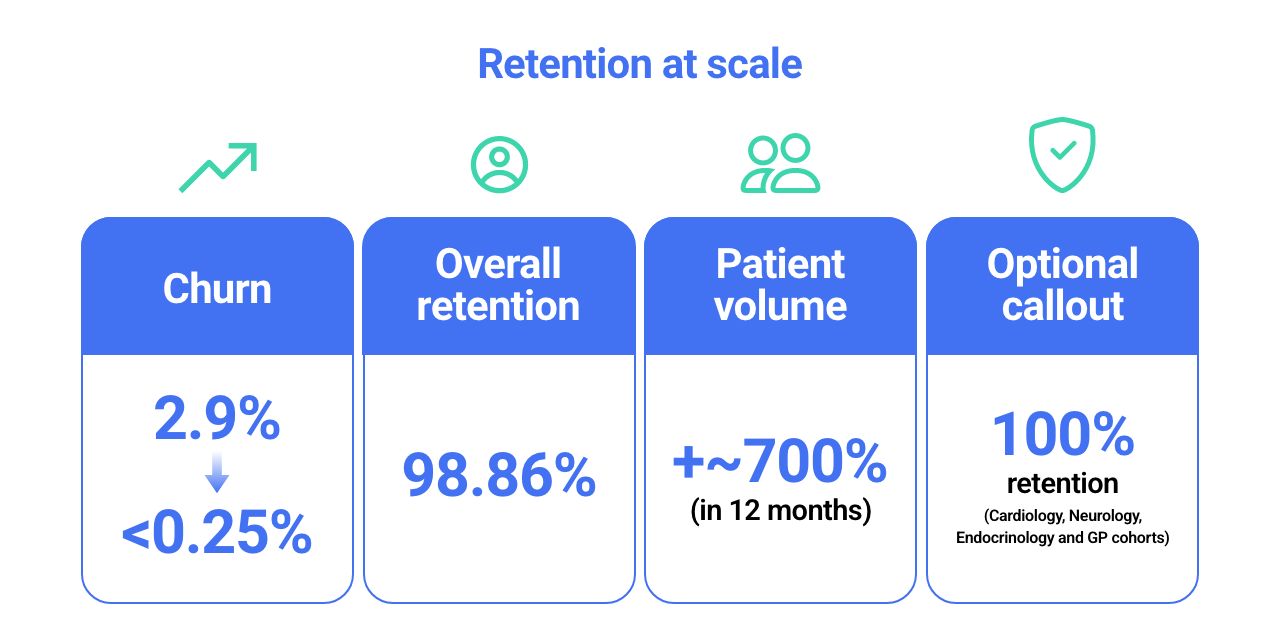
One of the clearest signals is the collapse in churn rate, from 2.9% to below 0.25%, as treatment adherence programs scaled by nearly 700% in patient volume over the past 12 months.
Today, overall patient retention stands at an average of 98.86%, with cohorts enrolled through Cardiology, Neurology, Endocrinology and GP programs reaching 100% retention.
The significance goes beyond the number itself. Maintaining such high retention while scaling suggests that the platform fits naturally into the daily workflow of both doctors and patients, supporting adherence consistently rather than creating an additional burden.
Earlier enrollment, earlier support
Another important shift is happening at the very beginning of treatment.
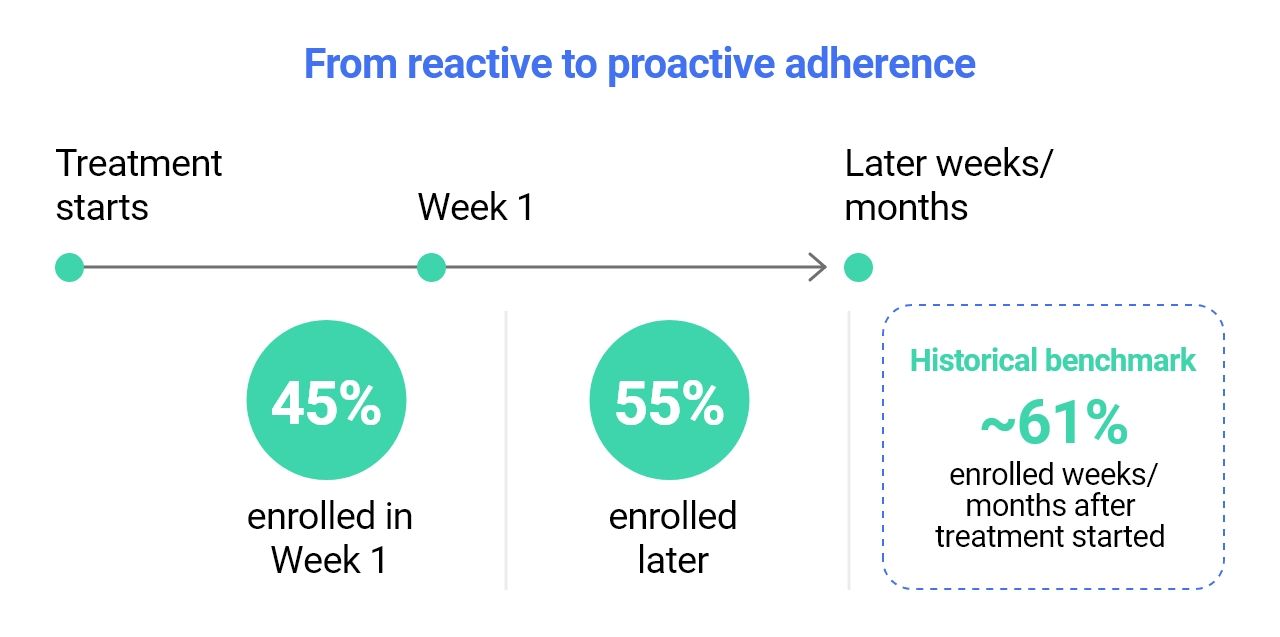
Today, nearly 45% of new patients are enrolled during the first week of treatment. Historically, approximately 61% of patients were enrolled weeks or months after treatment had already started.
This change suggests that HCPs are increasingly trusting the platform from day one and using it proactively — to help prevent adherence problems rather than address them only once they appear.
At the same time, the remaining cohort continues to be significant, at 55%, reinforcing the need for the platform to serve both patient profiles: those who are supported from treatment initiation and those who enter an adherence program later in their treatment journey.
This is also a key indicator when looking at the relationship between treatment initiation and retention in chronic therapies.
The Specialties mix
The data also reveals meaningful differences in how specialists engage with adherence programs.
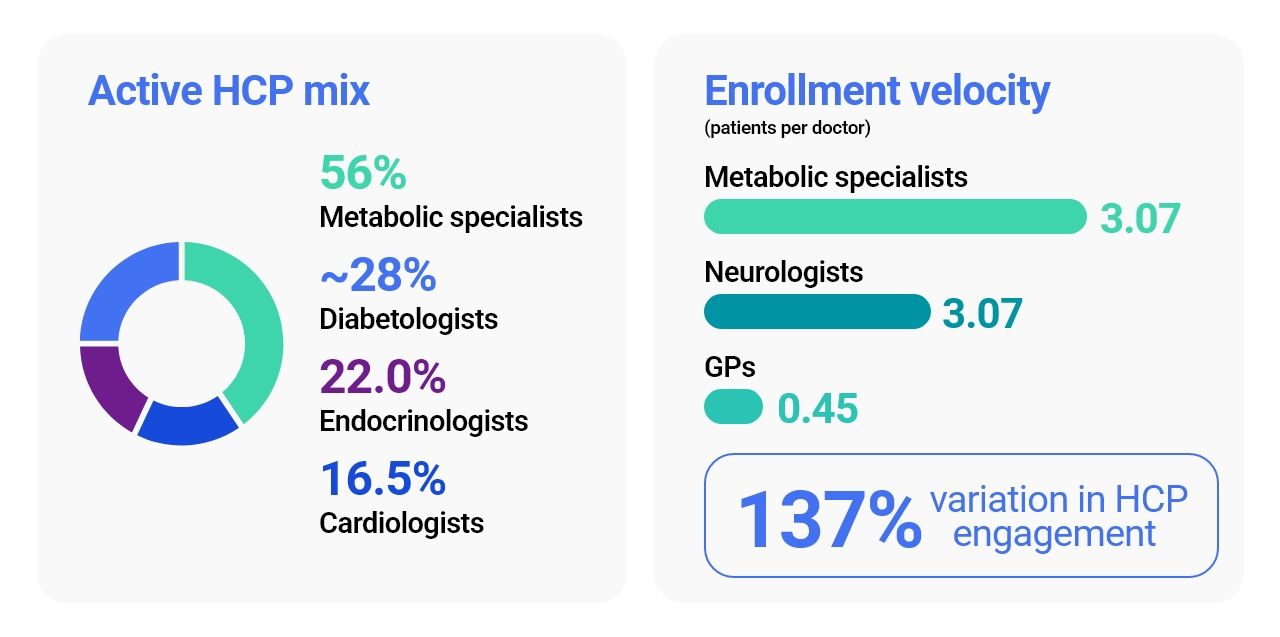
Metabolic specialists account for 56% of our active HCP base, including endocrinologists at 22.0%, diabetologists at ~28% and cardiologists at 16.5%.
Although cardiologists represent a lower total volume, they enroll patients at a rate 3.7% higher per doctor than diabetologists. This reinforces the role of specialists as the primary drivers of adherence program engagement.
Enrollment velocity also varies significantly between specialties. It ranges from 3.07 patients per doctor among metabolic specialists, to 1.68 among neurologists and 0.45 among GPs.
Overall, we are seeing a 137% variation between the highest- and lowest-engaging cohorts, even within the broader specialist ecosystem.
Two profiles of adherence program engagement
Across the active programs, two distinct HCP profiles are beginning to emerge.
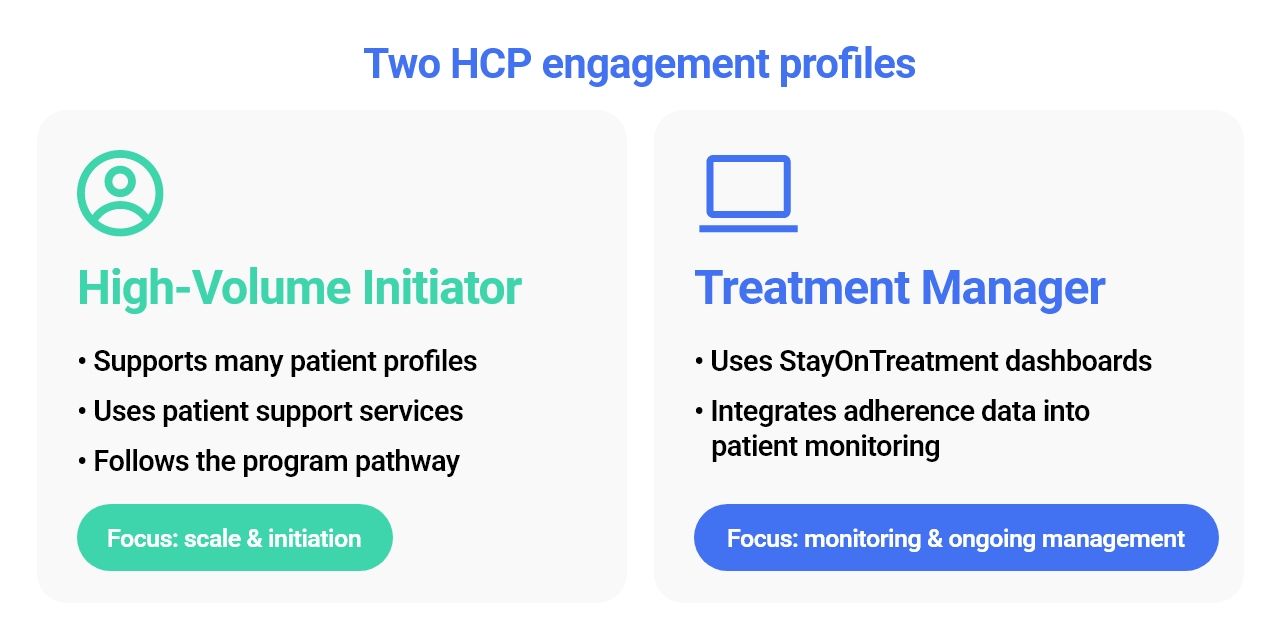
The first is the High-Volume Initiator: a doctor who uses patient support services across a broad range of patient profiles and is comfortable following the program pathway explained by the Pharma Company.
The second is the Treatment Manager: a doctor who incorporates StayOnTreatment dashboards into their patient monitoring routine, using them as an additional source of data alongside their existing workflow.
These profiles show that there is no single way for specialists to use the platform. Different workflows can coexist within the same adherence ecosystem, while still contributing to patient support and treatment continuity.